Previous OHLC Levels.
A precision TradingView indicator that plots the prior session's Open, High, Low, and Close on your chart.
Why these levels matter
The previous session's High and Low act as natural support and resistance. The Close tells you whether today's market is trading above (bullish) or below (bearish) the prior session. The Open shows where the previous session started, giving context to its directional move.
Together, these four levels provide a quick snapshot of where the market has been — helping you assess where it might go next. Add two instances to your chart (one Daily, one Weekly) for multi-timeframe analysis with independent color schemes.
Designed for traders who want clean, reliable reference levels without indicator bloat.
Day · Week · Month
Switch between previous period timeframes with a single dropdown. Add two instances for multi-timeframe analysis with independent color schemes.
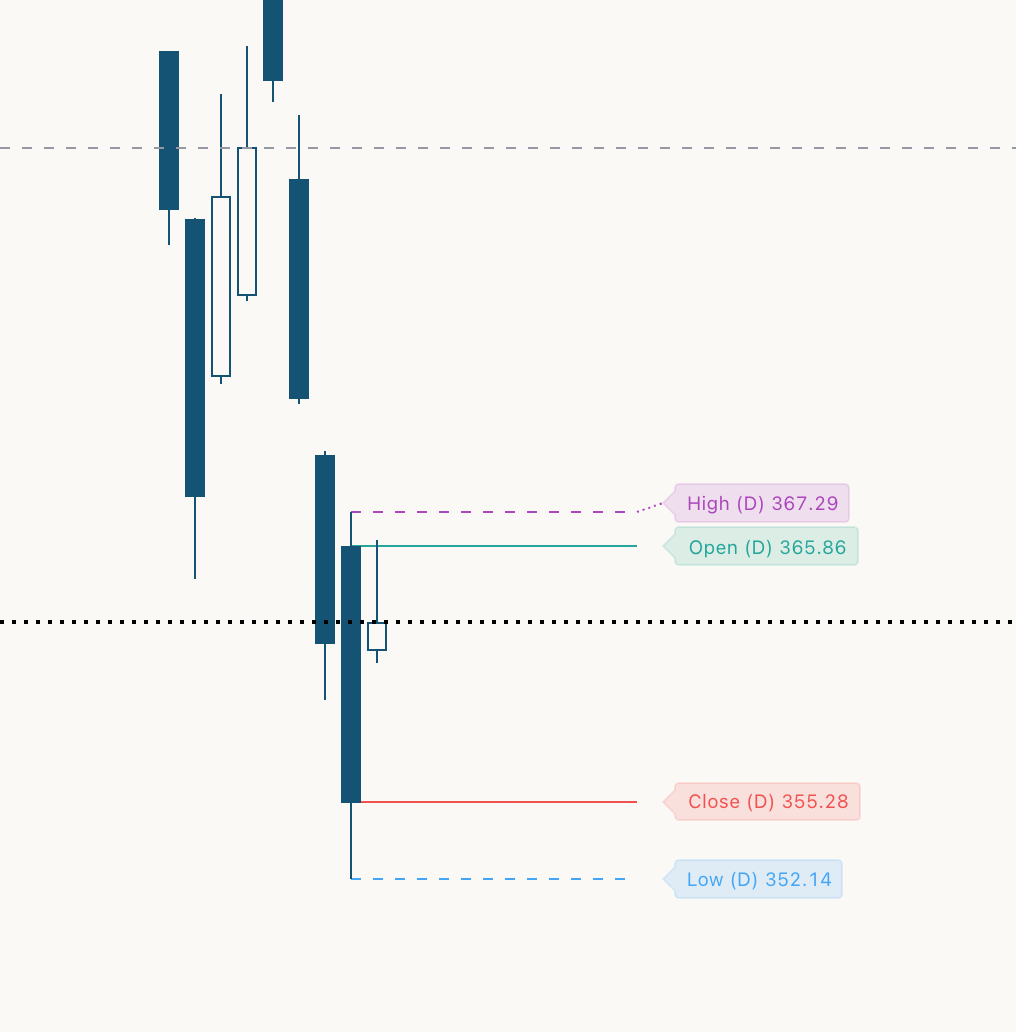
Smart Labels
Auto-formatted labels like "Open (D) 100.217" with anti-overlap logic. When levels are close together, labels spread apart with dotted connector lines showing which level they belong to.
Non-Repainting
Uses the [1] offset + lookahead_on method recommended by PineCoders. What you see on historical bars is exactly what you would have seen live.
Range Zone
Optional shaded area between High and Low to instantly visualize the prior session's trading range. Toggle it on or off depending on your chart style.
Fully Customizable
Every level has independent color, line width, line style, and visibility controls. Dial it in to match your chart theme exactly.
Anchored to Source
Lines start from the previous period's first candle, not just the current bar. This gives you visual context of where the level originated.
Under the hood
This indicator is also a learning resource. The full source code is available on GitHub under the Mozilla Public License 2.0 — read it, fork it, extend it. Here are three patterns worth studying:
Non-repainting data request
The core of any multi-timeframe indicator is how it fetches data. The [1] history offset combined with barmerge.lookahead_on ensures only confirmed, closed-period data is displayed — this is the PineCoders-recommended approach to prevent repainting.
Label collision detection
When OHLC levels are close together (common in low-volatility sessions), labels would overlap and become unreadable. The indicator sorts all active levels by price, detects when adjacent labels are closer than a configurable threshold, and pushes them apart — then draws dotted connector lines back to the actual price level.
Period-anchored line drawing
Instead of drawing lines only from the current bar, the indicator tracks when each period boundary occurs and anchors lines to the previous period's start bar. This gives a clean visual that shows exactly where the level came from.
Explore the source code
The full Pine Script is available on GitHub — 279 lines of clean, well-commented code. Read it to learn how multi-timeframe indicators work, or fork it as a starting point for your own.
View on GitHubThree steps, two minutes
Get up and running in no time.
Open Pine Editor
Click "Pine Editor" at the bottom of any TradingView chart.02 — Paste & Add
Copy the script from GitHub, paste it in the editor, and click "Add to chart". That's it.03 — Configure
Free, open source, and built with care. No email required — just grab the code and go.
Add it to your chart
Free, open source, and built with care. No email required — just grab the code and go.
Get the Indicator